|
|||||||||||||||
|
|||||||||||||||
|
|||||||||||||||
|
|
|||||||||||||||
|
|||||||||||||||
|
|

 Laboratori d'Estudis Geofísics
|
|
|
XE.FBRE.BHZ Continuous monitoring of the background seismic noise analysis (PSD) in near-real time(The origin of the time axis is January 1st, current year. Quality controlled data updated daily). Graphs corresponding to the current year
Daily "Base Level Noise Seismic Spectrum" (BLNSS), corresponding to the last four days. The red line represents the BLNSS computed using data recorded during the current year. It is computed by means of a continuous comparison of the amplitude of all PSD components for each day (blue=day-1; pink=day-2; dark blue=day-3; green=day-4).
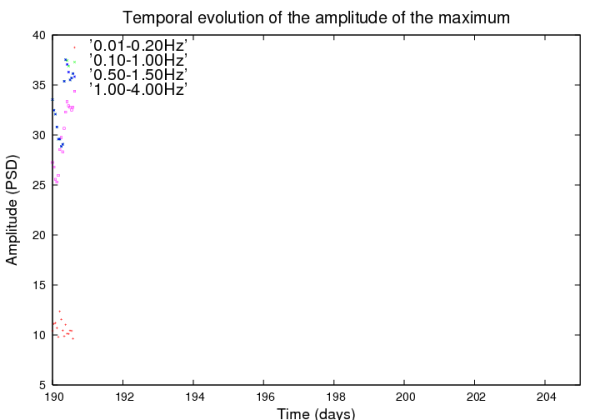
Time evolution of the maximum amplitude of the PSD in four frequency bands: 0.01 Hz - 0.20 Hz (red dots), 0.10 Hz - 1.00 Hz (green dots), 0.50 Hz - 1.50 Hz (blue dots) and 1.00 Hz - 4.00 Hz (pink dots).
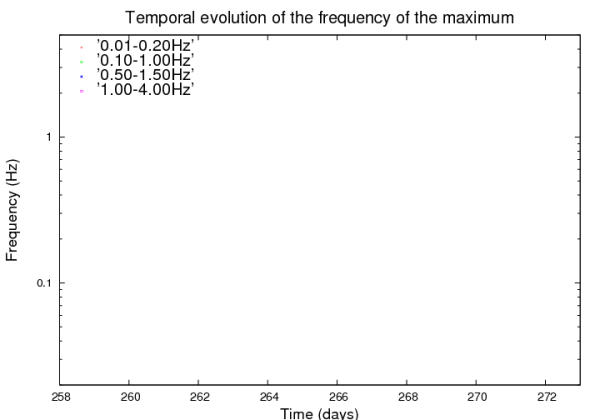
Time evolution of the frequency at which the maximum amplitude of the PSD occurs in four frequency bands: 0.01 Hz - 0.20 Hz (red dots), 0.10 Hz - 1.00 Hz (green dots), 0.50 Hz - 1.50 Hz (blue dots) and 1.00 Hz - 4.00 Hz (pink dots).
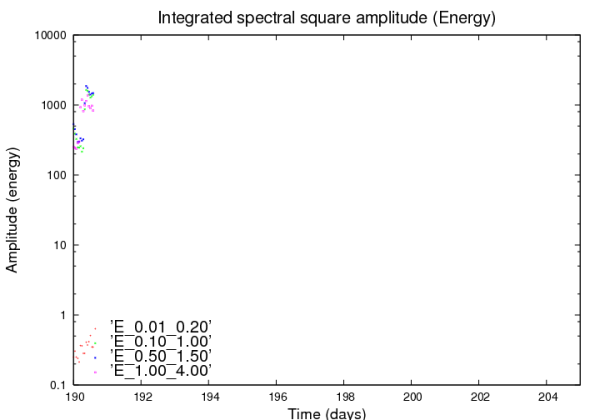
Time evolution of integrated spectral square amplitude in four frequency bands: 0.01 Hz - 0.20 Hz (red dots), 0.10 Hz - 1.00 Hz (green dots), 0.50 Hz - 1.50 Hz (blue dots) and 1.00 Hz - 4.00 Hz (pink dots).
Time evolution of the amplitude of some selected spectral components.
Graphs corresponding to the last 15 days
Time evolution of the maximum amplitude of the PSD in four frequency bands: 0.01 Hz - 0.20 Hz (red dots), 0.10 Hz - 1.00 Hz (green dots), 0.50 Hz - 1.50 Hz (blue dots) and 1.00 Hz - 4.00 Hz (pink dots).
Time evolution of the frequency at which the maximum amplitude of the PSD occurs in four frequency bands: 0.01 Hz - 0.20 Hz (red dots), 0.10 Hz - 1.00 Hz (green dots), 0.50 Hz - 1.50 Hz (blue dots) and 1.00 Hz - 4.00 Hz (pink dots).
Time evolution of integrated spectral square amplitude in four frequency bands: 0.01 Hz - 0.20 Hz (red dots), 0.10 Hz - 1.00 Hz (green dots), 0.50 Hz - 1.50 Hz (blue dots) and 1.00 Hz - 4.00 Hz (pink dots).
Time evolution of the amplitude of some selected spectral components.
|
||||||||||||||||||||||||||||
|
|
||||||||||||||||||||||||||||
|
||||||||||||||||||||||||||||